

Data and automation
Data acquisition and processing often take up a too big of a chunk from one’s working time. We don’t want our customers to waste their time on tedious (pre)processing of spatial and other datasets.
We offer tools that help you spend your time where it’s most valuable – using the data for gaining insights instead of collecting and processing it.
In the field of data automation, a rather standard work flow can be identified, each step of which is part of our repertoire:
- Identifying the research question: What question or problem do you want solve with the help of data?
- Data review: What data exists, or is additionally needed? Is the data quality suitable for solving the problem, or does it require some preprocessing?
- Data processing plan: How should the data be processed for the use case at hand? Does the data require fixing, supplementing, transformation, refinement, or combining with other data? What type of a data warehouse solution is available or required?
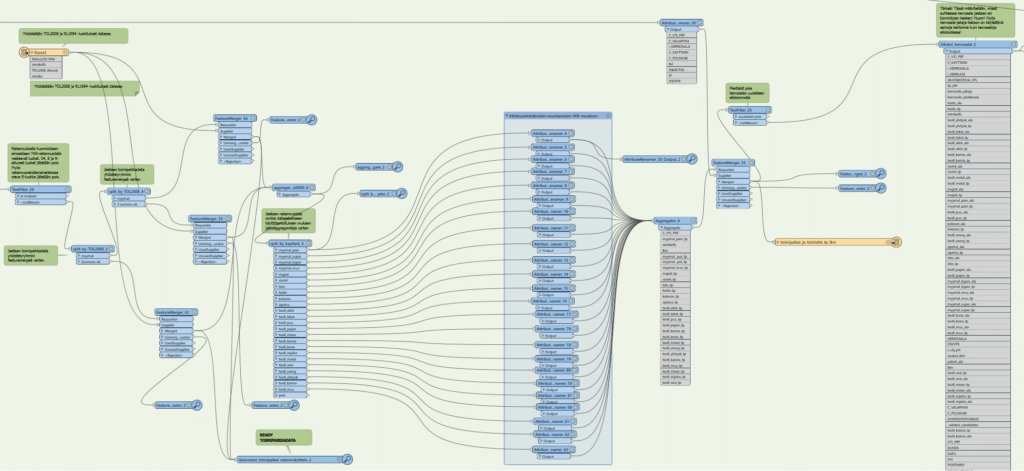
- Implementing and testing of automated data processing: Implementation of data pipelines, ETL or ELT processes. Often during this phase, problems arise, and the plan needs to be revisited. Testing and validation is key, since potential deviations and edge cases usually stand out first when processed data is available in masses.
- Data analysis: Often, after automated data processing or as a part of it, one may want to try to answer the research question directly, for instance by adding an algorithm layer specifically tailored to solve the problem.
- Data visualization and drawing conclusions: Once the data has been processed and analyzed, effective communication of the conclusions usually requires the implementation of concise reporting solutions.
Our repertoire includes many types of automatic data collection and processing solutions (e.g. ETL and ELT), which read and process data from databases, APIs and other data sources directly for our customers’ use. We always choose tools on a case-by-case basis, but our recent favorites include FME, Databricks, Snowflake, Apache Spark, PostGIS, Azure Data Factory, Python, pyqgis, and R.
To ensure the flow of data within the client organization and, if necessary, also outwards to stakeholders or openly to the public, we create interface services according to OGC standards (e.g. WFS, OGC API Features, WMS, WMTS, MVT) to distribute the created information.
As a final touch, we often integrate data processing pipelines into our client’s reporting environment as ready-to-use data visualizations, whether it is, for example, a business intelligence platform such as PowerBI or Tableau, or a workspace built into a geographic information system such as QGIS.